- How consistent are the earnings in five years?
- What is the PEG RATIO?
Most times, complicated analysis and compilations of ratios do speak volume but might not necessarily present the best of stocks for investment purposes. Of course, ratios will always present different angles of a company and its stocks quite well but might also complicate investment decisions because of the changing patterns of the components with which the ratios were arrived at and the decision to determining to precision, specific figures to act as lead. This is so because in most cases, while some ratios might appear negative, some might be looking brilliant so what should be done- to buy or not to then becomes an issue.
Over the ages, formulae had been deployed as research tools to pick good stocks but losses still abound even in firms with seeming appearance of best in research and information services.
I’ve seen institutions in our Nigerian market that do claim to be experts in research but how much they in turn, invest in the market needs be ascertained. Truth is, the best you could do for yourself is to let your experiences be your own research tools, at that, a simple analysis of companies’ earnings might just work the miracle of picking a good stock in the short term, it could also be price action. Guess what? Taking these simple steps will never be as complicated as compiling data to calculating the Beta of company. This is also such data that are easily found all over. This is what this piece seeks to deploy to seeing what stocks to consider as the market sets to receive 2018 Q3 earnings in another week or thereabout. Let’s flash back to see what we can gather from just the earnings reports of ten banks over a period of five years.
ACCESS BANK PLC:
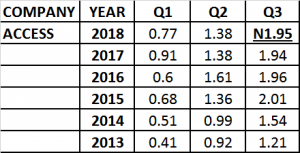
Though Access Bank Plc had grown its Q1 earnings by 87.80% since 2013, the road does not seems to have been that smooth with intermittent current year decline on previous year’s level. As observed, there was a decline of 11.76% in Q1 2016 against the figures of 2015 and another 15.38% in 2018 against 2017.
Q2 earning of the bank was progressive from 2013 till 2017 when there was a 14.28% decline. 2018 Q2 was flat against the previous year. Q3 earnings also showed significant growth till 2016 when there was a marginal drop of 2.49%. The bank is yet to beat its 2015 performance level where it reported N2.01 in its Q3 as 2017 Q3 was marginally down from the level of 2016.
2018 has proven not to be that smooth for Access Bank Plc going by the drop in its Q1 earnings in comparison with 2017 level and the flat Q2 earnings so reported. Consequently, the bank’s 2018 Q3 earnings is expected to be within the same range as the 2017 level except there comes an extra ordinary item.
CONCLUSION:
Current and estimated P/E Ratio is good but annual EPS growth stands to pull price down a little lower. Medium to long term hold is recommended.
FBNH:
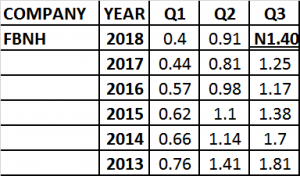
In the five years period covered in the earnings performances of FBNH, significant growth is lacking. As a matter of fact, Q1 had over a period of five years declined by 47.36% from the 2013 level to 40kobo in 2018 from 76kobo in 2013. In other words, Year-on-Year, FBNH had reported lower Q1 earnings of current against previous year.
Q2 also had declined from N1.41 in June 2013 to 91kobo in 2018 though the bank returned a measure of growth in 2018 against 2017 but till 2017, the organisation recorded a decline of 42.55%. On the 2018 Q2 performance, there was a 12.35% growth.
Q3 performances of FBNH since 2013 had declined consistently, climaxing in 2016 before the decline was arrested in 2017 with a growth of 6.83%. Between 2013 and 2016, FBNH’s Q3 earnings had declined 35.36%.
Gauging these figures with general industry records, it could be inferred that declines so recorded in all the three quarters covered herein were more of personal, internal issues that were peculiar to the institution.
The trend in the earnings reports summarises that FBNH is yet having issues with Q1 whereas it has found its feat in Q3 more than Q2. It thus infers therefore that though the environment is harsh, the organisation is not expected to break the Q3 growth pattern into decline again. Consequently, its 2018 Q3 earnings is hereby projected to be in the region of N1.40
PEG RATIO: 0.53
CONCLUSION:
Apparently, previous consistent decline in earnings had been greeted by equal level of decline in price such that expected improvement of between 10 and 12% on its 2017 Q3 earnings will make current price level cheap enough for medium to long term hold.
GUARANTY BANK PLC:
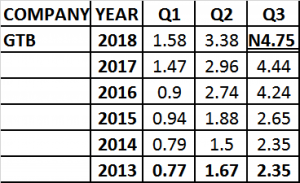
Despite changing policies which in some cases are most unfavourable, Guaranty Trust Bank Plc in the last five years had maintained consistent growth outlook from one quarter to another, year in, year out. The bank is simply a well managed financial institution.
The growth pattern of the bank’s Q1 is dramatic with 105% earnings growth in five years. Aside from 2016 when there was a decline of 4.25%, investment could be made against the bank’s Q1 earnings with eyes closed as the bank bounced back in its Q1 in the following year with a geometric growth of 63.33% which was the highest in the five years under review. This infers that Guaranty Trust Bank Plc should not be counted out when it is seen down.
Aside from a decline recorded in 2014 against 2013, the bank’s Q2 had grown consistently and in some cases, geometrically with the least being about 8% recorded between 2017 against 2016. The bank recorded 14.2% growth this year against its performance in 2017.
GT Bank had recorded equal numbers in 2013 and 2014 and marginal growth between 2016 and 2017 but then, from where it was in 2013, till 2017, its Q3 had grown by 89%.
FORECAST Q3 2018:
Significantly, it could be deduced that GTB builds its earnings right from the day one in the year. In other words, performance of its Q1 had always led to performances in other quarters. 2018 has show similar pattern. Seeing therefore that GTB had not grown its Q3 over Q2 below 40% since 2013, with a record of N3.38 earnings in the 2018 Q2, Q3 2018 is not expected to be lower than N4.75
PEG RATIO= 1.09
CONCLUSION:
Current price is just appropriate based on the expected Q3 2018 earnings growth rate. The stock price might not rise in response to the expected impressive earnings because of current market trend. Non-the-less, it is good for medium term hold.
UNITED BANK FOR AFRICA PLC:
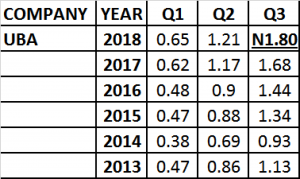
From 2014, UBA had shown moderate but consistent growth in earnings. Further observations also revealed significant improvements in quarter on quarter growth from 2016 though the figures in 2018 largely saw moderate growth in Q1 and Q2 over 2017 levels. This apparently resulted from relatively harsh economic climate.
Over a period of five years as contained in the table above, UBA had always performed better moving from Q1 to Q2 than from Q2 to Q3 in the sense that percentage growth of Q2 over Q1 in these five years was far above percentage growth of Q3 over Q2. Whereas percentage growth from Q1 to Q2 in the five years under review could be estimated to be between 82 and 88%, percentage growth from Q2 to Q3 had been 40 and 55%.
The bank’s N1.21 2018 Q2 showed a marginal 3.41% growth from the N1.17 reported in 2017 while the 2018 Q2 was a growth of 86% over the Q1 figure. This was one of its best recorded within the five years under review.
Premised on the trend in earnings performance, seeing that Q2 from Q1 of 2018 remains about the best so recorded by the bank in a period of five years, projected 2018 Q3 earnings is N1.80. If this achieved, please see the PEG ratio below.
PEG RATIO: 0.64
UBA recently touched its year low but has growth 17% thereafter. The PEG RATIO significantly points to the fact that current price level is yet low with room for growth. Current market trend stands to impede price growth at the release of Q3 earnings but a clear pointer to the fact that the stock deserves a mid-term hold.
ZENITH BANK PLC:
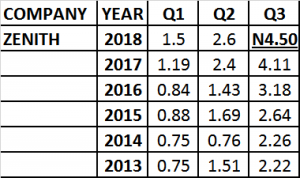
The market is currently discounting the power of Zenith Bank Plc’s earnings. This can only subsists for a period. At the appropriate time, this will be reversed and holders of the stock will be net beneficiaries.
Zenith earnings sure do respond to negative changes in the system but they never remain down. This is a mark of strength. Significantly too, components of its profits are a little different from others.
Of the three quarters in review over a period of five years, Zenith is most consistent in Q3. While 2016 saw lower figures in Q1 and Q2 in comparison with 2015 performances, Q3 in 2016 recorded growth against the figures of 2015. In other years, steady growth is observed since 2016 in all the three quarters in consideration.
Going by the bank’s Quarter on Quarter performances, having reported N2.60 in Q2 of 2018 from N1.50 in Q1 and N2.40 in Q2 of the previous year, Q3 2018 is expected to be around N4.50.
PEG RATIO: 0.51
CONCLUSION:
In the face of Zenith Bank’s expected earnings for the Q3, it will be abnormal to see its price below current price. The reason for this assertion is the fact that PEG ratio is already standing below 1 which technically suggests that the stock is already grossly undervalued at current price. Consequently, further decline makes the stock a bargain for discerning investor who can wait.