- P.E ratio, Book value, Year High/Low Price Analysis
If investment in stocks is treated as normal transaction of buying and selling, the best for an investor at any point in time is an entry at relatively comfortable price, with the mindset for an exit at higher price level than the entry. At that, due considerations are needful at the entry and close monitoring in the process of holding the stock. These are essentials seeing that market trends and fundamentals do change and in most cases, in the opposite direction to performances of specific companies.
It is noteworthy to categorically state the fact that equity selection process might not come easy as there are many metrics that could be deployed. The question remains how and when does a stock become cheap? Let’s take a look at just a few.
P/E Ratio:
Many times, a Cheap Stock could be easily be determined by a Low Price-to-Earnings Ratio but then, just like other metrics, there are limitations based on the cyclical nature of the companies involved but P/E Ratio is still largely considered as a back of the envelope analysis in finding a cheap stock. It sounds over simplified quite well but it remains true that the relationship between current price and earnings of a stock will largely remain relevant in the comparative analysis between one stock and another in same industry and between a year and another in same stock. Of course this is bound to change often and so should investors update the data base and keep tab on the changing figures to be well guided.
Year Low/ High Prices against Current Price:
Technically speaking, tracking high and low price levels of a stock might just tell a little about how cheap or expensive a stock has become. In most cases, these are the prices that often form the support and resistance levels. Support is that price level a stock price gets to and it refuses to decline below while resistance is the level a price gets to and it finds it difficult to climb further at an immediate period as these are often later broken.
Questions need be asked if a decline persist. If such decline is propelled by either realistic or expected poor performance from a company, it could be said to be justified but in cases where a company keeps releasing good reports while the price dwells at support level or its year low, it could be technically stated that such stock is cheap at that price though further confirmation might be required to initiate a purchase. In most cases, a year low could be further adjusted down depending on the elongation of market downtrend. A stock that is trending around its year low is however such that should be paid close attentions to particularly if the company fundamentals are sound enough.
Book Value and Price-To-Book Value Ratio:
A company’s book value is a figure calculated from the balance sheet of a company, it represents the net worth (assets – liabilities) of the company on per share. It is often referred to as shareholder’s equity. Book value tells of the relationship between the assets and liability of a company.
Book value analysis brings to fore the question on what does an investor really buy in a stock, could it be the name, assets or what? It is arguable because stocks are not being bought for a company to be stripped and investors share the proceeds but truth is that it should be more than what an investor should be interested in, in a stock is the assets the institution has been able to accumulate over years and much more, future possibilities in assets growth. Book value simply tells of per share accruals to a holder of one unit of a stock should all the companies assets be sold. It thus infers that at every point, it should interest investors what the book value per share of a company is, relative to its stock price on the stock exchange which is the making of the market. When book value is divided by the number of outstanding shares, we get the book value per share (BVPS)
In a situation therefore, where an equity’ price is lower than the company’s book value per share, such a stock could be considered cheap with higher possibilities of future price growth. This is not however to state that higher stock prices than book value should suggest a ‘no buy’ rating as that could suggest a level of confidence in the organisation going forward but even at that, such a stock could not be said to be cheap.
It is possible for a corporation’s stock price to fall below book value, meaning the stockholder has a chance to buy into the firm for less than the accounting basis of the net assets. If things turn around, this can be a huge windfall.
In view of the foregoing, let’s take a quick look at a few stocks within the limit of space.
ACCESS BANK
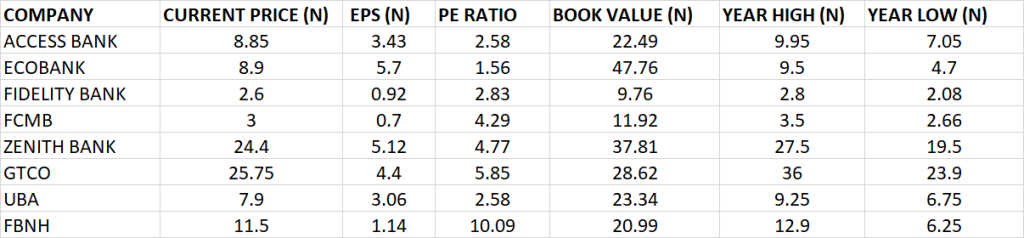
Access Bank is currently trading at N8.85, with year high of N9.95 and year low of N7.05. It is trading 11.06% away from its 52 weeks high of N9.95, which implies an uptrend potential for the stock.
Access Bank is expected to pay at least a final dividend of 55 kobo in addition to the 30 kobo interim dividend already paid to shareholders.
On the basis of the bank’s Q3 2021 earnings per share of N3.43, book value at N22.49 and the P/E ratio standing at 2.58x, make the stock a bargain at the current price.
ZENITH BANK
Zenith Bank is expected to pay a final dividend of N2.70 in addition to 30 kobo interim dividend already paid.
Currently trading at N24.4 and the price has touched a high of N27.5 and a low of N19.50 in the past 52 weeks. It has an uptrend potential of 11.27% relative to its 52 weeks high of N27.50.
On the strength of its Q3 earnings of N5.12, Zenith Bank’s book value at N37.81 and P/E Ratio standing at 4.77x, make the stock a bargain at current price as it could be said to be selling at 35.47% away from its book value.
GUARANTY TRUST BANK
The share price of Guaranty Trust Holding Company on Friday closed at N25.75. In the last 52 weeks, the price of GTCO has touched a high of N36 and a low of N23.90. There is an uptrend potential of 28.47% relative to its year high of N36.
The bank is expected to pay at least N2.70 final dividend in addition to 30 kobo interim dividend already paid to shareholders.
The Q3 2021 earnings per share of N4.40 at a current share price of N25.75 gives a low P.E ratio of 5.85x.
The book value of N28.62 implies that stock is trading within the region of its fair value.
By the time GTCO consolidates its HoldCo structure, the share price will grow significantly beyond its current level.
UBA
UBA is currently trading at N7.9 and it has touched a high of 9.25 and a low of N6.75 in the last 52 weeks. UBA has an uptrend potential of 14.59% relative to its year high of N9.25.
UBA is expected to pay at least a final dividend of 35 kobo in addition to 20 kobo dividend already paid to shareholders.
With Q3 earnings per share of N3.06, relative to the current share price of N7.9, UBA has a low P/E ratio of 2.58x.
With the book value at N23.34, relative to the current price of N7.9, UBA is considered very cheap.
FBNH
The renewed interest in FBNH by investors was triggered by substantial shareholding power tussle by certain high net worth individuals. This led to the recent growth in the share price of the big elephant.
Currently trading at N11.50, the share price of FBNH in the last 52 weeks has touched a high of N12.90 and a low 6.25. It has an uptrend potential of 10.85% relative to its 52 weeks high of N12.90.
Although its Q3 2021 earnings per share declined to N1.14 from N1.90, the P.E ratio of FBNH stands at 10.09x.
FBNH is expected to pay at least a final dividend of 45 kobo, same as what they paid the previous year.
With the book value at N20.99, relative to the current price of N11.50, FBNH is considered cheap.
FIDELITY BANK
Fidelity Bank is currently trading at N2.6 with a year high of N2.80 and year low of N2.08. It is trading 7.14% away from its 52 weeks high of N2.80.
With Q3 earnings per share of 92 kobo, relative to the current share price of N2.6, Fidelity Bank has a low P/E ratio of 2.83x.
Fidelity Bank is expected to pay at least a final dividend of 22 kobo, same as what they paid the previous year.
A book value at N9.76, relative to the current price of N2.6, implies that Fidelity Bank is trading below its intrinsic value. This suggest an uptrend potential for Fidelity Bank.
ECOBANK
Ecobank is currently trading at N8.90 and the share price has touched a high of N9.50 and a low of N4.70 in the last 52 weeks. At N8.90 Ecobank has upside potential of 6.32% relative to its year high.
Q3 2021 earnings per share of N5.70 and the current share price of N8.90 gives a low P/E ratio of 1.56x, which suggests that the price of the stock is cheap.
Book value of N47.76 relative to the current price of N8.90 makes Ecobank very cheap.
FCMB
The share price of FCMB is currently trading at N3 with the year high of N3.5 and year low of N2.66. It is trading 14.29% away from its 52 weeks high of N3.5.
With Q3 2021 earnings per share of 70 kobo, relative to the share price of N3 gives a low P/E ratio of 4.29x for FCMB.
FCMB is expected to pay at least a final dividend of 15 kobo, same as what the paid the previous year.
FCMB has a Book value of N11.92. Relative to the current price of N3, it can be said that FCMB is underpriced.