The month of March had come and gone and so was Q1 of the year 2018, so how did stock markets across the African continent perform in both the month of March and Q1 of the year?
Q1 2018:
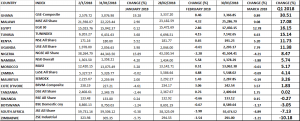
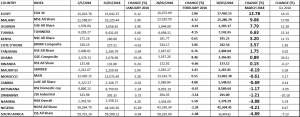
From an open of 2,579.72 on January 02, 2018, Ghana’s GSE- Composite index closed on the last trading day in March 2018 at 3,366.85 thus recording a growth of 30.51% to lead all other markets in the continent within the limit of our coverage.

Ghana’s central bank lowered its monetary policy rate in March 2018 by a further 200 basis points to 18.0 percent, saying inflation is continuing to decline amid moderate price pressures, and it is on course to meet the its inflation target within the forecast horizon.
In January, the BOG noted emerging pressure on underlying inflation in the last two months of 2017 so it kept the policy rate steady to ensure it reaches its inflation target this year.
The bank’s main measure of core inflation, which excludes energy and utilities, dropped to 11.3 percent in February from 12.6 percent in December and inflation expectations by businesses, consumers and the financial sector showed that expectations were anchored toward the medium-term inflation target of 8.0 percent, plus/minus 2 percentage points.
Prices of Ghana’s main exports, such as gold, cocoa and crude oil, rebounded somewhat in the first two months of this year, and data and surveys show that the growth momentum seen in 2017 was continuing this year.
Ghana’s economy grew by an annual rate of 9.3 percent in the third quarter of last year, up from 9.0 percent in the second quarter, and BOG said growth prospects for 2018 remain positive, supported by crude oil production, a gradual recovery in the non-oil sector and favourable sentiment.
The government’s budget deficit is also continuing to narrow and fell to 6.0 percent of Gross Domestic Product in 2017 compared with a target of 6.3 percent, helping total debt decline to 69.8 percent of GDP in 2017, down from 73.1 percent of GDP in December 2016.
Domestic debt amounted to 66.7 billion Cedi while external debt was 75.8 billion, with the maturity profile showing an increase in longer-dated instruments.
Notably, most of Ghana’s GSE- Composite index’ growth came in January when it recorded 19.28%. Though it was still upbeat in February with a growth of 8.46%, that was largely below the performance of the previous month. In March, Ghana’s market recorded only a marginal growth of 0.89%.
The Malawian stock market is another to watch out for in the continent, in 2018 as the MSE All Share index came second in performance with a growth of 17.08% within the first quarter of the year under review. In addition to this, the MSE All Share was the second best in the month of March with a growth of 9.08%. Earlier in January, it was a growth of 2.90% and 4.32% in February 2018.
Egypt’s EGX 30 was the best in Africa in the month of March 2018 with a Month-on-Month growth of 12.78%. The country’s broad index had opened the month at 15,472.69 and closed at 17,450.15. for the first quarter of 2018, Egypt’s EGX 30 was the third best with a growth of 16.15%. earlier in January, the index had recorded marginal 0.12% growth and another 2.86% in February. The nation’s economy has been on the path of growth since 2017 in response to government’s economic policies.
On the flip side, Zimbabwe’s ZSE Industrial was the highest loser with a decline of 10.18% for the quarter under review. The index had opened the year at 329.98 only to close on March 29, 2018 at 291. The rate of decline however is sure slowing as it recorded just -1.21% decline in March as against -5.75% in January and -3.54% in February.

Other major declining markets in the quarter include South Africa with a decline of 7.13% for the quarter and -4.89% in March though the JSE All Share index was up 0.38% in January and 1.98% in February of the year.