Dr Ajibola Awolowo
I grew up in a local government staff quarters that had 12 building blocks with each containing six 2-bedroom flat apartments over 2 floors. It was a well-planned estate with tarred roads, a main gate that led into the estate, green play areas and lots of Mango trees scattered all around.
My favourite time of the year was when the mango trees produced fruit. I was always eager to go fetch water from the communal tap as we would use that opportunity to binge on mangoes. Some years, the trees produced so many mangoes that the excess fruits will fall, rot away and produce a very peculiar stench. In other years, the fruit produced will be so meagre that children in the estate will get into squabbles over the rights to pluck them.
I never really understood why in some years, mango fruits would be excessive and in others, very scarce. Very recently however, I stumbled on the term ‘Mast year’ and it all made sense. The term ‘Mast’ is used to describe the fruits of forest trees. We now know that, in some years, due to reasons such as favourable weather conditions, trees produce vast number of fruits almost resulting in a glut. When this happens, it is called a mast year. At other times though, very minimal numbers of fruits are produced.
It is quite unclear why this phenomenon happens. Some experts believe that having an unpredictable harvest helps regulate the population of animals that feed on the fruits and promotes the survival of only healthy animals. In other words, having occasional periods of hardship which are unpredictable is helpful to the ecosystem. With persistent food gluts, unhealthy animals survive and their weak genes may be passed on to their offspring while persistent famines may kill off even the most resilient of species. Nature itself knows that too much of everything is harmful.
During the week, I stumbled on a chart published by Mr Chidi Uzo on LinkedIn which showcased the monthly returns on the Nigerian Exchange All share index and total annual returns over the last 10 years.
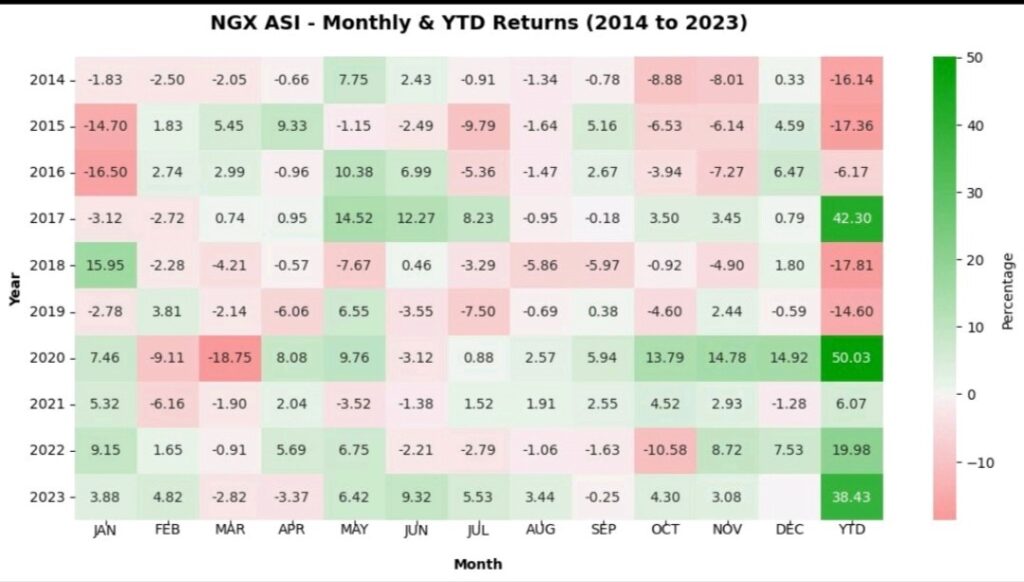
As I spent time reflecting on the chart, I found a few things that appeared obvious to me but could be easily overlooked by others. I hope to share my takeaway lessons from the chart in this article.
LESSON 1: Market cycles are real
The concept of Mast years is not limited to botany but can also be seen in investing. Out of the 10 years seen on the chart, the first 6 years (2014 – 2019) produced a decline in value of the NGX ASI except in 2017 where the market went up. This 6-year period of bearish sentiments was quickly followed by 4 years of a bullish run.
Just as in nature, in investing, too much of a thing is harmful. An unrelenting bear market discourages market participants while the opposite produces fat, entitled and lazy investors. The concept of market cycles comes in very handily here. With favourable economic conditions, companies generate high profits, build new factories, undertake large numbers of mergers/ acquisitions which leads to an influx of competition into that industry as owners of capital seek avenues to earn a return on them.
As competition heats up, costs increase and profit margins decline. Due to the rapid expansion of companies in that sector during the good years, an excess of production capacity is now usually in place. Companies end up laying off staff, closing factories to reduce cost which leads to a recession in the economy and death of the weak companies. With reduced competition, profit margins improve once again and the cycle repeats itself.
When companies flourish and profits soar, share prices go higher which attracts retail investors into the market hoping to make easy money in stocks. This is a self-fulfilling prophecy as the increased demand for stocks leads to higher stock prices which further attract more investors. Once the economic situation changes and company profits decline, investors who were hitherto buyers of stocks suddenly become sellers and justle to get out of the market which then lead to sustained declining prices.
Investors must always remember that bull and bear cycles exist in the stock market. Stock prices do not always go up. Neither do they always go down. We should aim to invest in such a way that when prices surge higher, you are positioned to benefit from it while when prices drop like a brick, you can weather the storm without getting a margin call.
LESSON 2: Avoid recency bias
Newtons first law of motion states that an object will remain at rest or at constant speed in a straight line unless acted upon by an external force. In a sense you can argue that this law applies to markets as well. This is because markets build momentum and heads in one direction until some news or event, good or bad, acts on the market to change its course.
Some retail investors can however get carried away by this momentum that may have built up. They somehow think that if the market has been up for 2 years, then it is bound to be up in the 3rd year as well or vice versa. This is called “Recency Bias”. It is the erroneous thinking that since something happened recently, it will keep happening that way in the future.
They forget that there are thousands of external forces that act on companies and the market in an intricate and often unpredictable manner. These factors range from macroeconomic variables such as interest rates, exchange rate, political good will to industry or company specific variables such as crude oil prices, government policies etc.
From the chart, the market made consistent losses in 2014 through to 2016. Recency bias may dictate that 2017 will also be a loss-making year but the market returned more than 40% that year. 2020 till 2023 have been very positive years for the market. If you are structuring your portfolio in a way that anticipates that 2024 will follow suit, then you have learnt nothing from this write up.
LESSON 3: It is impossible to time the market
I am sure that one “master” trader is rolling his or her eyes somewhere on seeing this point. They are probably thinking to themselves that, using all the technical analysis skills and tools at their disposal, they can correctly predict what the market will do and can get in and out of the market to maximize their profit. If you are this person, I hope the force be with you.
Looking at the chart, let’s assume one misses out on the best 3 months, or even, 1 month, of the year due to trying to time the market. What impact will this have on the overall annual returns?
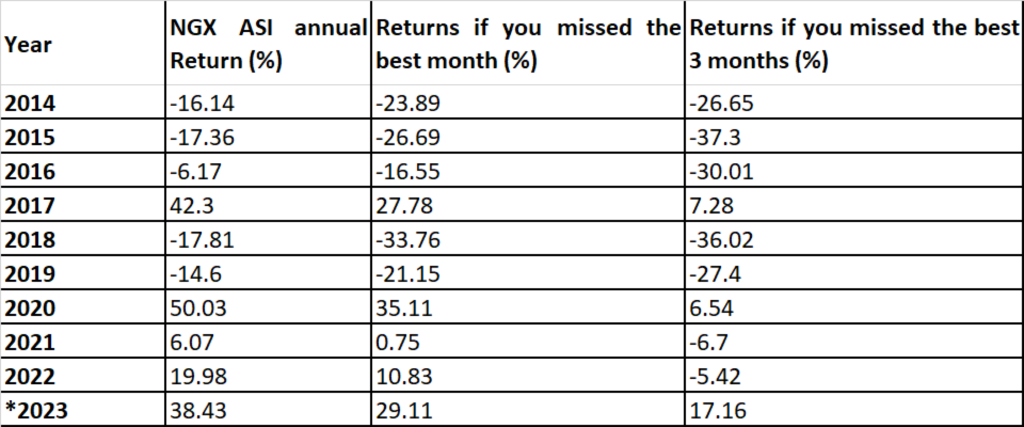
From the chart above, missing the best month of the year leaves a huge dent in one’s annual returns. This is even worsened by missing the best 3 months in the year. All the time and effort spent in trying to time the market is better spent in rigorous company selection and portfolio construction/ asset allocation.
The day that someone proves to me that they have been able to avoid the worst months of the year while benefitting consistently and predictably from the best months of the year using any market timing tool or tricks, I will hail that person as the next richest man in the world.
The way out of this is to stay invested through thick and thin. Have a systematic and automated way of adding to your investments in both good years and bad years. Don’t waste time waiting for the clouds to gather or clear before sowing or reaping. Have a process that works for you and stick with it.
Dr Ajibola Awolowo is the Host of Value Nigeria Podcast. He can be reached via this email: Valuenigeriawithajibola@yahoo.com