- How consistent are the earnings in five years?
- PEG Ratio Analysis
We have eventually entered the Fourth Quarter of the year, and in a matter of weeks Q3 results of quoted firms will start hitting the market. As the market anticipates the Q3 results of these companies, smart investors are already taking position against their expectations.
It is worthy to note that expectation is the mother of all investment strategies. Investment in stocks is done against expectation and not on realities. In other words, you are buying into a company based on what you think you can get; that is expectation.
Most times, complicated analysis and compilations of ratios do speak volume but might not necessarily present the best of stocks for investment purposes. Of course, ratios will always present different angles of a company and its stocks quite well but might also complicate investment decisions because of the changing patterns of the components with which the ratios were arrived at and the decision to determining to precision, specific figures to act as lead. This is so because in most cases, while some ratios might appear negative, some might be looking brilliant so what should be done- to buy or not to then becomes an issue.
Over the ages, formulae had been deployed as research tools to pick good stocks but losses still abound even in firms with seeming appearance of best in research and information services.
We deem it necessary to do earnings forecast for banking stocks ahead the release of their Q3 earnings for 2021.
Our projections of Q3 earnings for banks is based on their PEG ratios. PEG ratio (price/earnings to growth ratio) is a valuation metric for determining the relative trade-off between the price of a stock, the earnings per share (EPS), and the company’s expected growth. In other words, it is not enough for anyone to invest on just the strength of a company’s previous or latest earnings but these in addition to the expected earnings.
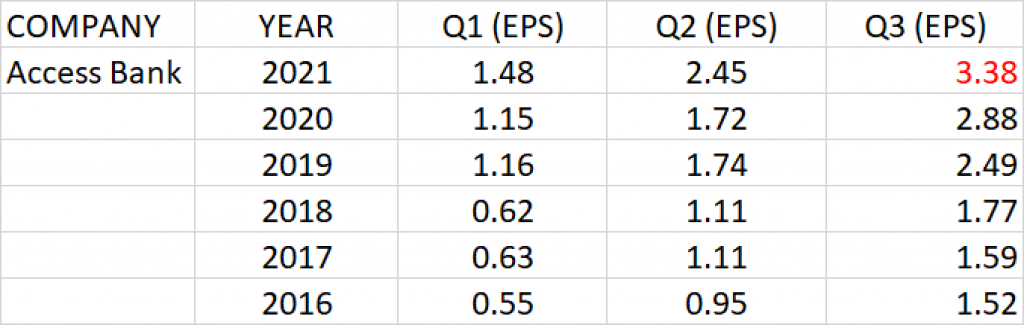
ACCESS BANK
Earnings history of Access Bank Plc for Q1, Q2 and Q3 for the past 5 years show that the bank has been consistent in improving on its earnings per share year on year.
Consistent growth is observed in the bank’s results within a financial year, Q1 to Q3. In other words, there was not a lower performance in a current quarter than the preceding quarter within a financial year.
Q3 earnings per share (EPS) of the Access Bank over the last 5 years has a Geometric Average Growth rate of 17.32%.
Relative to the current share price of N9.15 and Q3’20 earnings per share of N2.88, P.E ratio is estimated at 3.18x.
PEG ratio against the expected Q3 2021 earnings is 0.18 and it implies that the share price of Access Bank at current price is underpriced.
Q3 Earnings per share of about N3.38 is projected for Access Bank Plc.
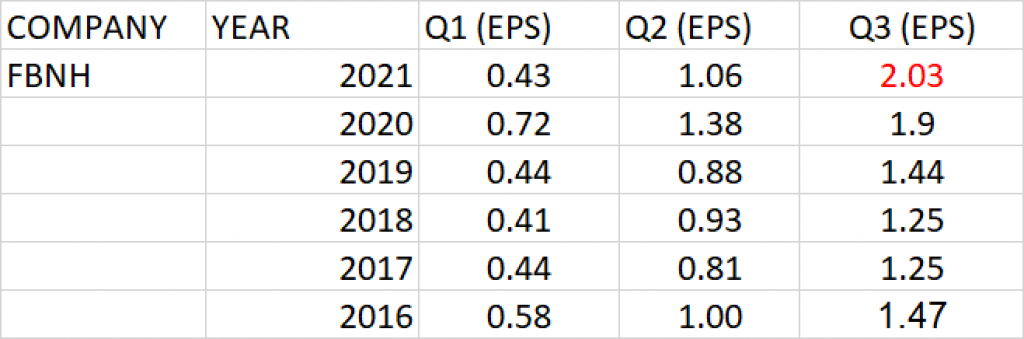
FIRST BANK OF NIGERIA HOLDINGS (FBNH)
Q3 earnings per share (EPS) of First Bank of Nigeria Holdings over the last 5 years has a geometric average growth rate of 6.63%.
At the share price of N8.05 and Q3’20 earnings per share of N1.90, P.E ratio of the bank is calculated as 4.23x.
PEG ratio against the expected Q3 earnings is 0.60, being less than 1 implies that the share price of FBNH is underpriced.
The EPS of N2.03 is projected for FBNH against its Q3 2021 earnings release.
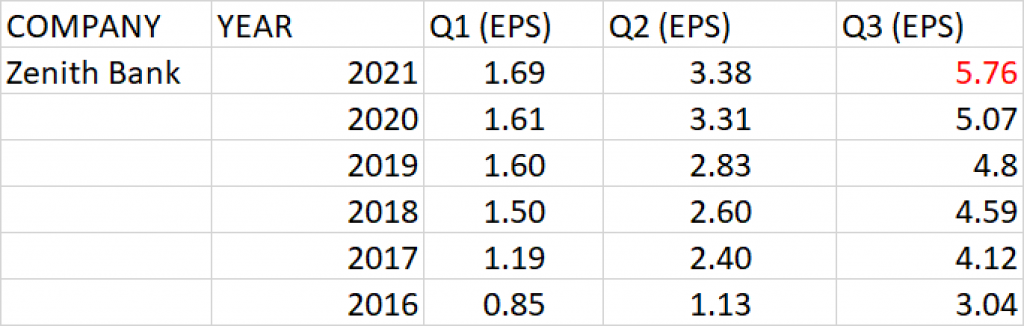
ZENITH BANK
Zenith Bank has performed over the years with consistent growth in turnover, profit after tax and earnings per share especially with good dividend pay-out record.
Earnings history of the Bank for Q1, Q2 and Q3 for the past 5 years show that the bank has been consistent in improving on its earnings per share year on year.
Consistent growth is observed in the bank’s results within a financial year, Q1 to Q3. In other words, there was not a lower performance in a current quarter than the preceding quarter within a financial year.
Q3 earnings per share (EPS) of the bank over the last 5 years has a geometric average growth rate of 13.64%.
At the current share price of N23.45 and Q3’20 earnings per share of N5.07, P.E ratio is calculated as 4.63x.
PEG ratio against the expected Q3 earnings is 0.34, which makes the share price of Zenith Bank underpriced at current price.
Q3 2021 earnings per share of N5.76 is projected for Zenith Bank.
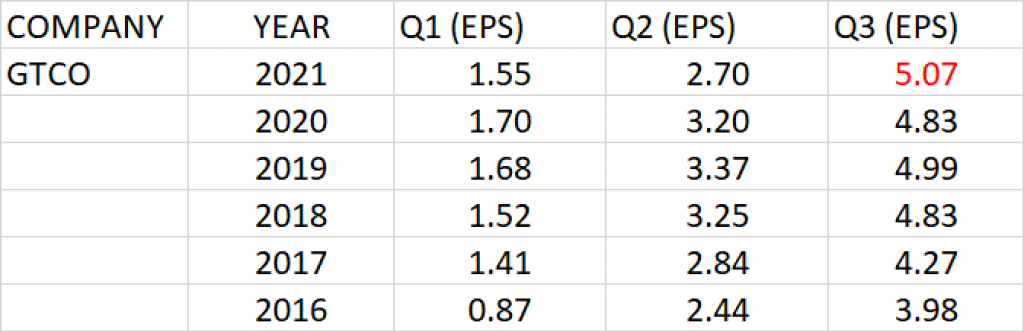
GUARANTY TRUST HOLDINGS
The half year result of Guaranty was rather low compared to what they reported the previous year. Even at that, they still paid interim dividend of 30 kobo.
Q3 earnings per share of Guaranty in the past 5 years have shown consistent growth, except for Q3 2020 where it dropped by 3.21% to N4.83 from the EPS of N4.99.
Earnings growth rate of Guaranty Trust in the last 5 years is 4.96%
At the current share price of N28.05 and Q3’20 earnings per share of N4.83, P.E ratio is calculated as 5.81x.
PEG ratio against the expected Q3 earnings is 1.16.
Q3 earnings per share of N5.07 is projected for Guaranty Trust Bank.
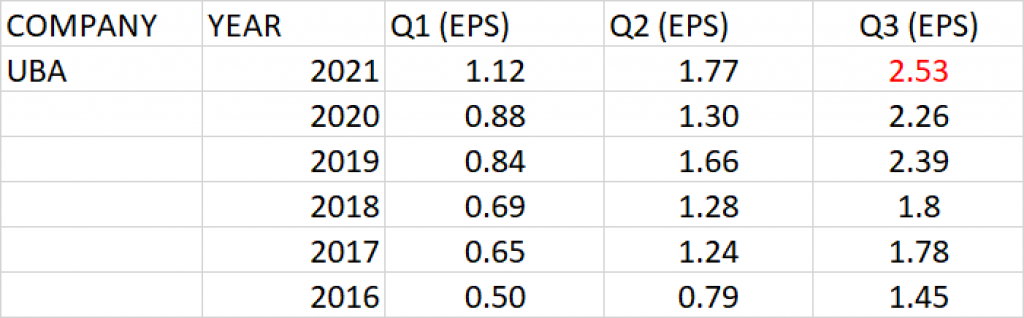
UNITED BANK FOR AFRICA
Q3 earnings per share of UBA over the last 5 years has a geometric average growth rate of 11.73%.
Relative to the current share price of N7.55 and Q3’20 earnings per share of N2.26, the P.E ratio of the Bank is evaluated as 3.32x.
PEG ratio against the expected Q3 earnings is 0.28, being less than 1 makes the share price of UBA underpriced at current price.
Q3 2021 earnings per share of about N2.53 is projected for UBA.
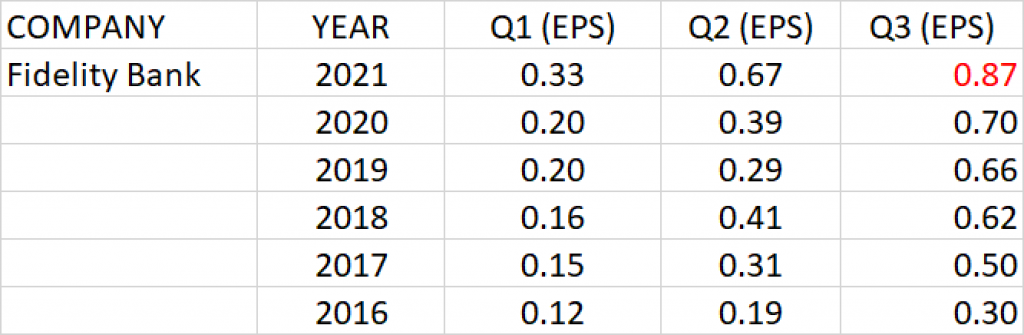
FIDELITY BANK
Q3 earnings per share of Fidelity Bank over the last 5 years has geometric average growth rate of 23.59%.
At the current share price of N2.47 and Q3’20 earnings per share of N0.70, P.E ratio of Fidelity Bank is calculated as 3.53x.
PEG ratio against the expected Q3 earnings 0.15 and this implies that Fidelity Bank is underpriced.
Q3 2021 earnings per share of N0.87 is projected for Fidelity Bank.
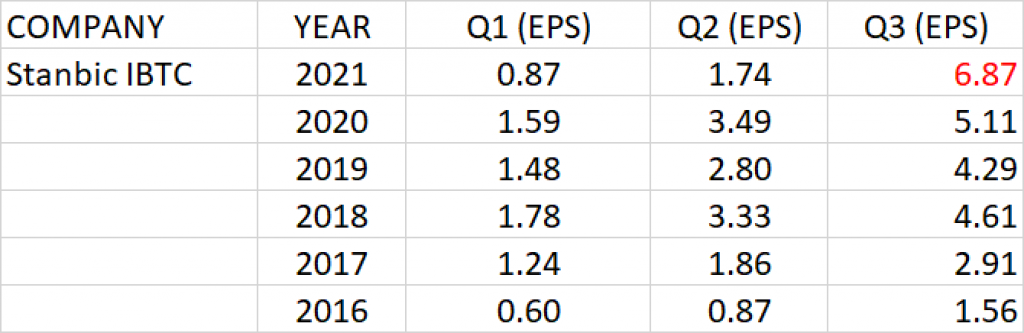
STANBIC IBTC
Q3 earnings per share of Stanbic IBTC over the last 5 years has geometric average growth rate of 34.53%.
At the current share price of N39 and Q3’20 earnings per share of N5.11, P.E ratio of Stanbic IBTC is calculated as 7.63x.
PEG ratio against the expected Q3 earnings 0.22.
Q3 2021 earnings per share of N6.87 is projected for Stanbic IBTC.
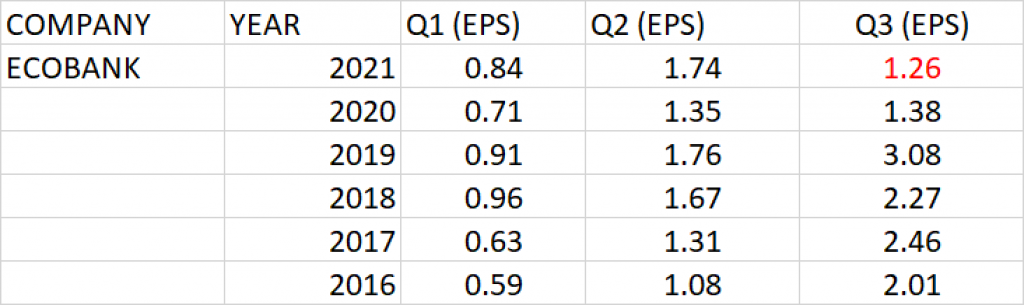
ECOBANK
Q3 Earnings history of Ecobank Transnational Incorporated over the last 5 years has a negative growth rate of -8.97%.
At the current share price of N5.4 and Q3’20 earnings per share of N2.65, P.E ratio of Ecobank is calculated as 1.89x.
PEG ratio against the expected Q3 earnings is -0.43.
Q3 2021 earnings per share of about N1.26 is projected for Ecobank.
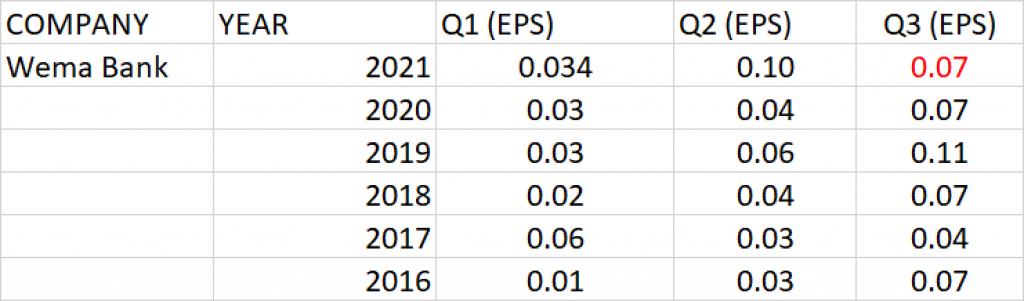
WEMA BANK
The Q3 earnings per share of Wema Bank in the last 5 years has ranged between 4 kobo and 7 kobo with earnings growth rate of 0.81%.
Relative to the current share price of N0.80 and Q3’20 earnings per share of N0.07, P.E ratio of the bank is calculated as 11.43x.
Q3 2021 earnings per share of Wema Bank is projected to be in the region of 7 kobo.
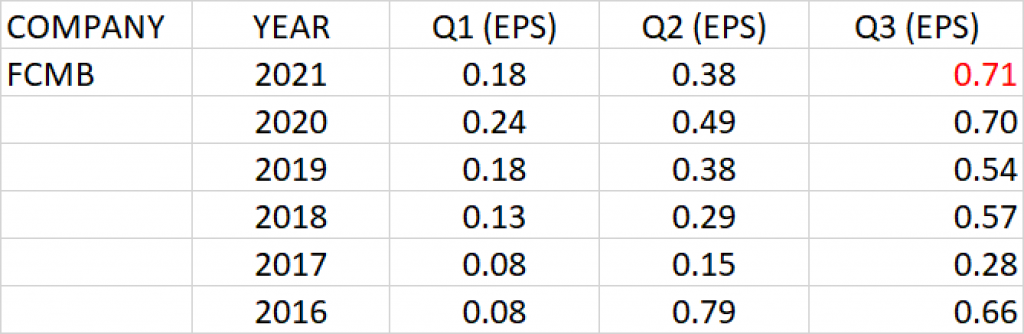
FCMB
Q3 earnings per share of FCMB over the last 5 years has geometric average growth rate of 1.48%.
At the current share price of N2.89 and Q3’20 earnings per share of N0.70, P.E ratio of the Bank is calculated as 4.13x.
PEG ratio against the expected Q3 earnings 2.86.
Q3 2021 earnings per share of N0.71 is projected for FCMB.
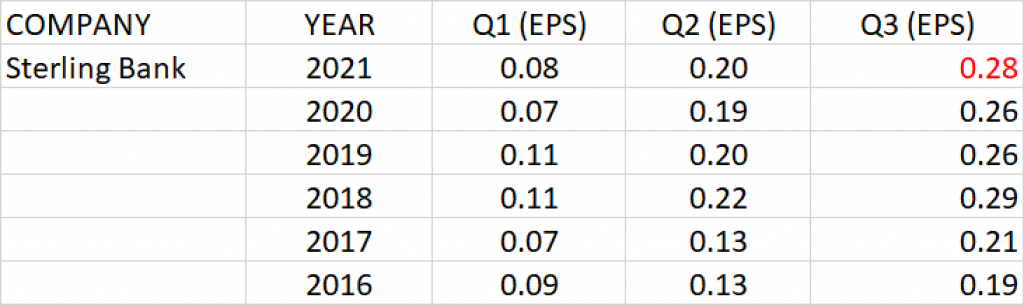
STERLING BANK
Q3 earnings per share of Sterling Bank over the last 5 years has geometric average growth rate of 8.16%.
At the current share price of N1.47 and Q3’20 earnings per share of N0.26, P.E ratio of Sterling Bank is calculated as 5.65x.
PEG ratio against the expected Q3 earnings 0.69.
Q3 2021 earnings per share of N0.28 is projected for Sterling Bank.
UNION BANK
Q3 earnings per share of Union Bank over the last 5 years has geometric average growth rate of 3.68%.
At the current share price of N4.9 and Q3’20 earnings per share of N0.52, P.E ratio of Union Bank is calculated as 9.42x.
PEG ratio against the expected Q3 earnings is 2.59.
Q3 2021 earnings per share of N0.54 is projected for Union Bank.

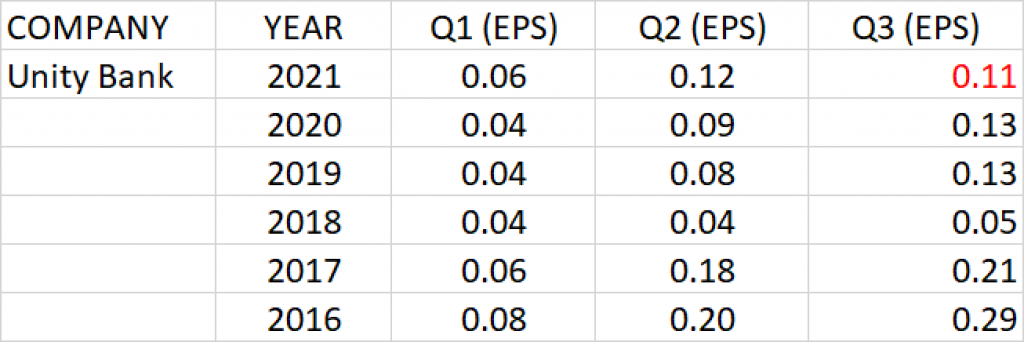
UNITY BANK
Q3 earnings per share of Unity Bank over the last 5 years has negative growth rate of -18.17%.
At the current share price of N0.53 and Q3’20 earnings per share of N0.13, P.E ratio of Unity Bank is calculated as 4.08x.
PEG ratio against the expected Q3 earnings -0.23.
Q3 2021 earnings per share of N0.11 is projected for Unity Bank.