- How consistent are the earnings in five years?
- PEG Ratio Analysis
The Second Quarter of the year will be over in a matter of weeks, and by design results of listed Companies on the Nigerian Exchange will start hitting the market from the second week of July.
Impressive performance of Companies in their FY 2021 and Q1 2022 results was adequately rewarded with price appreciation as quite a number of stocks grew significantly. Profit taking have also brought down the prices of stocks, creating new entry opportunities for discerning investors.
In anticipation for Q2 2022 results of quoted companies, it is wise for investors to start taking position ahead of these results. Expectation is the mother of all investment strategies. Investment in stocks is done against expectation and not on realities. In other words, you are buying into a company based on what you think you can get; that is expectation.
We deem it necessary to do earnings forecast for banking stocks ahead the release of their Q2 earnings for 2022.
Our projections of Q2 earnings for banks is based on their PEG ratios. PEG ratio (price/earnings to growth ratio) is a valuation metric for determining the relative trade-off between the price of a stock, the earnings per share (EPS), and the company’s expected growth. In other words, it is not enough for anyone to invest on just the strength of a company’s previous or latest earnings but also in addition to their expected earnings.
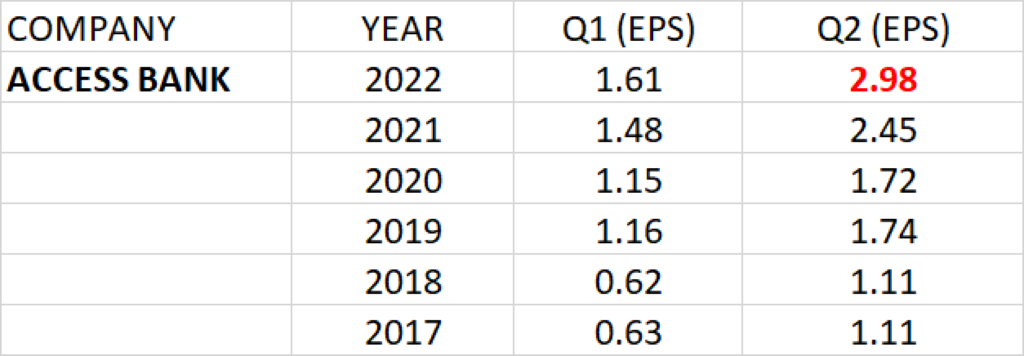
ACCESS HOLDINGS
Earnings history of Access Bank Plc for Q1 and Q2 for the past 5 years show that the bank has been consistent in improving on its earnings per share year on year.
Consistent growth is observed in the bank’s results within a financial year, Q1 to Q2. In other words, there was not a lower performance in a current quarter than the preceding quarter within a financial year.
Q2 earnings per share (EPS) of the Access Bank over the last 5 years has a Geometric Average Growth rate of 21.89%.
Relative to the current share price of N9.8 and Q2 2021 earnings per share of N2.45, P.E ratio is estimated at 4.00x.
PEG ratio of the Holding Company against the expected Q2 2022 earnings is 0.18. This implies that Access Holdings is underpriced.
Earnings per share of about N2.98 is projected for Access Holdings Plc in Q2 2022.
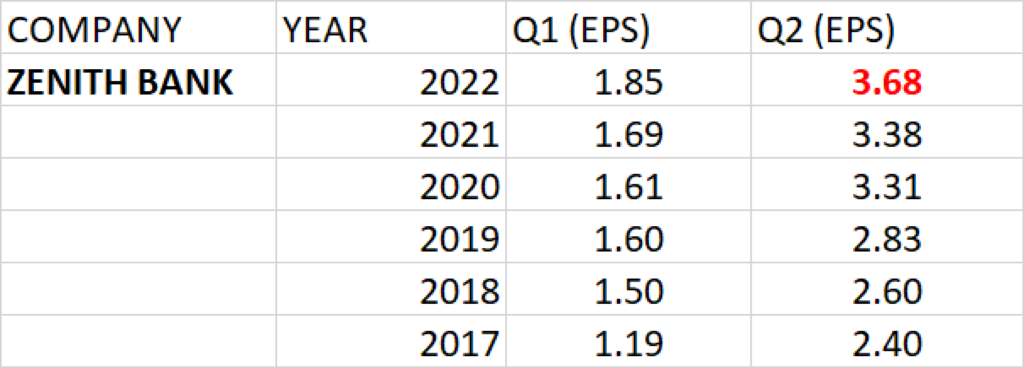
ZENITH BANK
Zenith Bank has performed over the years with consistent growth in turnover, profit after tax and earnings per share especially with good dividend pay-out record. Consistent growth is observed in the bank’s results within a financial year, Q1 to Q2.
Q2 earnings per share (EPS) of the bank over the last 5 years has a geometric average growth rate of 8.94%.
At the current share price of N22.85 and Q2 2021 earnings per share of N3.38, the P.E ratio is calculated as 6.76x.
PEG ratio against the expected Q2 earnings is 0.76, which makes the share price of Zenith Bank underpriced at current price.
Q2 2022 earnings per share of N3.68 is projected for Zenith Bank.
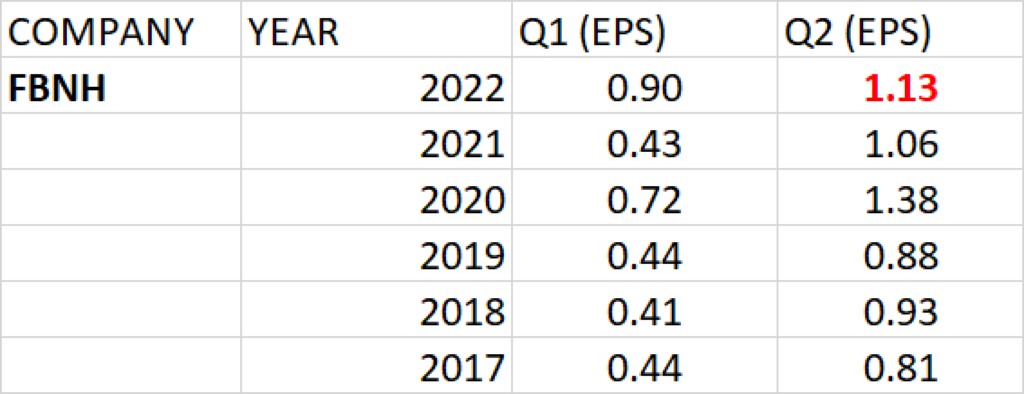
FIRST BANK OF NIGERIA HOLDINGS (FBNH)
Q2 earnings per share (EPS) of First Bank of Nigeria Holdings over the last 5 years has a geometric average growth rate of 6.96%.
At the share price of N10.55 and Q2 2021 earnings per share of N1.06, P.E ratio of the bank is calculated as 9.95x.
The EPS of N1.13 is projected for FBNH against its Q2 2022 earnings release.
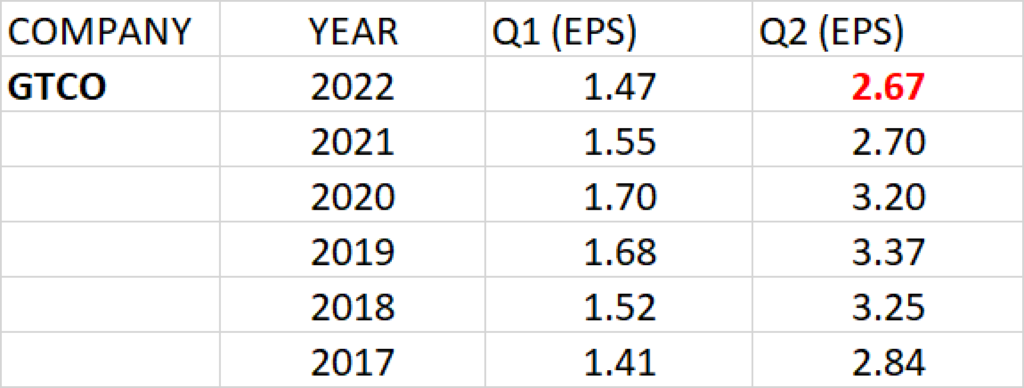
GUARANTY TRUST HOLDINGS
Q2 earnings per share of the financial institution over the past 5 years has a negative growth rate of -1.26%
At the current share price of N22 and Q2 2021 earnings per share of N2.70, P.E ratio is calculated as 8.15x.
Q2 2022 earnings per share of N2.67 is projected for GTCO.
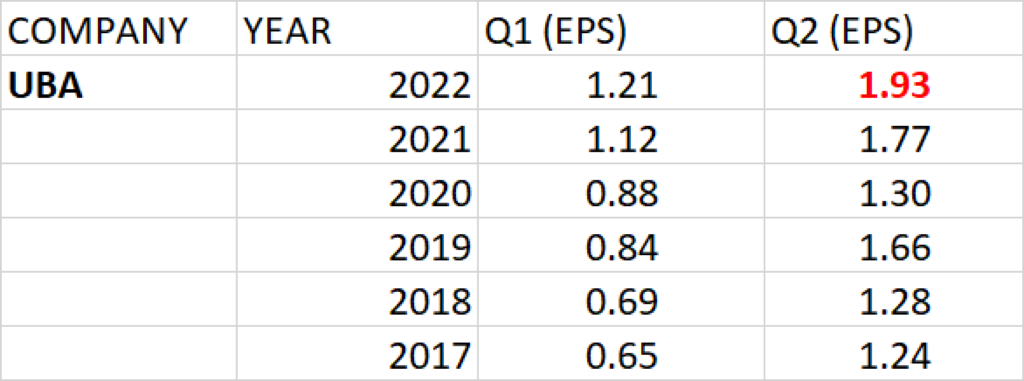
UNITED BANK FOR AFRICA
Q2 earnings per share of UBA over the last 5 years has a geometric average growth rate of 9.30%.
Relative to the current share price of N7.70 and Q2 2021 earnings per share of N1.77, the P.E ratio of the Bank is calculated as 4.53x.
PEG ratio against the expected Q2 earnings is 0.49, being less than 1 makes the share price of UBA underpriced at current price.
Q2 2022 earnings per share of about N1.93 is projected for UBA.
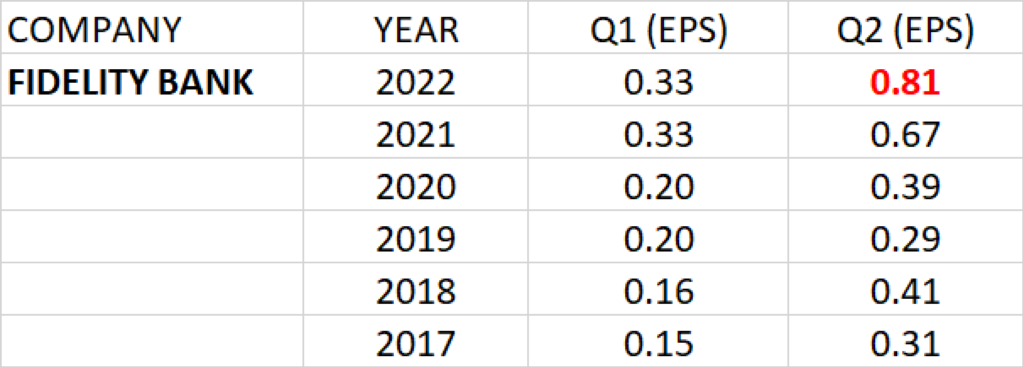
FIDELITY BANK
Q2 earnings per share of Fidelity Bank over the last 5 years has geometric average growth rate of 21.25%.
At the current share price of N3.28 and Q2 2021 earnings per share of N0.67, P.E ratio of Fidelity Bank is calculated as 4.90x.
PEG ratio against the expected Q2 earnings 0.23 and this implies that Fidelity Bank is underpriced.
Q2 2022 earnings per share of N0.81 is projected for Fidelity Bank.
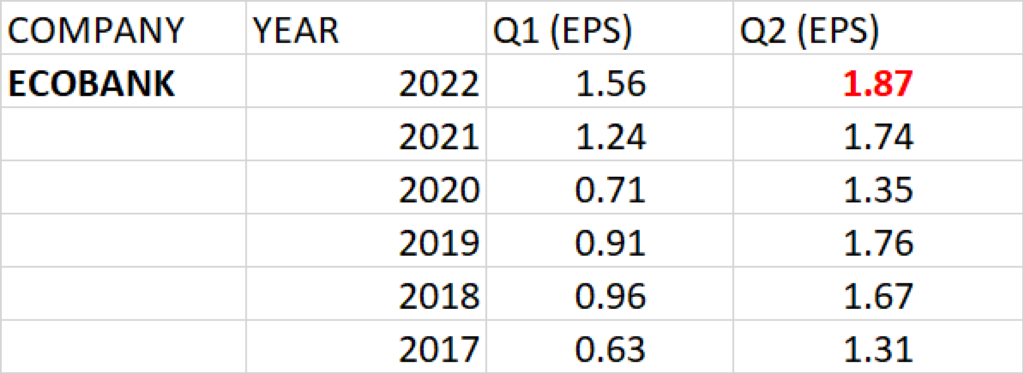
ECOBANK
Q2 Earnings history of Ecobank Transnational Incorporated over the last 5 years has a geometric average growth rate of 7.35%.
At the current share price of N11.1 and Q2 2021 earnings per share of N1.74, P.E ratio of Ecobank is calculated as 6.38x.
PEG ratio against the expected Q2 earnings is 0.87 and this implies that Ecobank is underpriced.
Q2 2022 earnings per share of about N1.87 is projected for Ecobank.
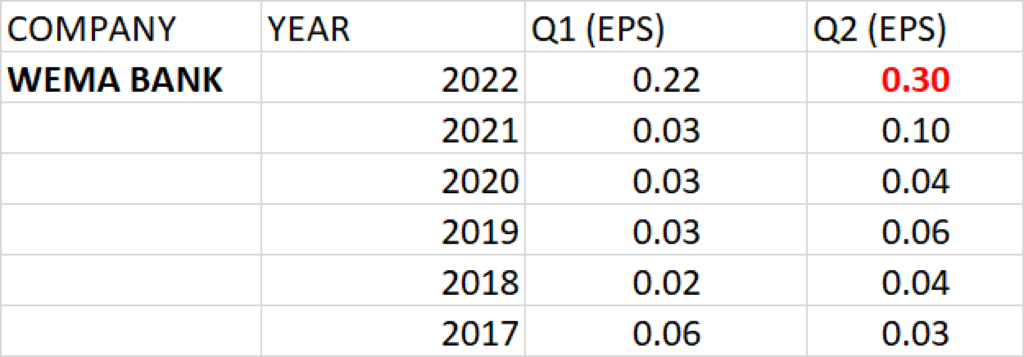
WEMA BANK
The Q2 earnings per share of Wema Bank in the last 5 years has ranged between 3 kobo and 10 kobo with earnings growth rate of 35.1%.
The recent Share Reconstruction in Wema Bank significantly boosted the earnings per share of the Bank to 22 kobo in Q1 2022 from the EPS of 3 kobo reported in Q1 2021; that is a growth of 64.56% year on year.
Based on the significant growth in Q1 2022 earnings of the Bank, the Q2 2022 earnings per share of the Bank is expected to grow beyond the EPS of 10 kobo reported in Q2 2021.
Relative to the current share price of N3.20 and Q2 2021 earnings per share of 10 kobo, P.E ratio of the bank is calculated as 32x.
PEG ratio against the expected Q2 earnings is 0.91 and this implies that Wema Bank is underpriced.
Q2 2022 earnings per share of about 30 kobo is projected for Wema Bank.
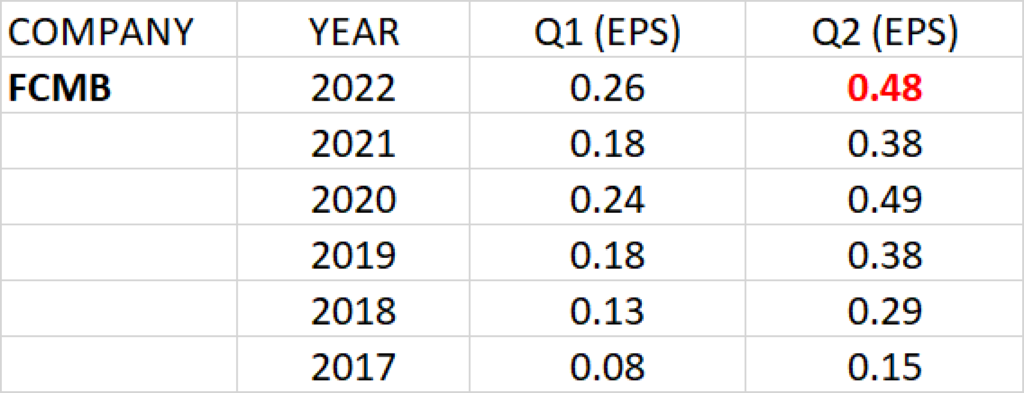
FCMB
Q2 earnings per share of FCMB over the last 5 years has geometric average growth rate of 26.16%.
At the current share price of N3.50 and Q2 2021 earnings per share of N0.38, P.E ratio of the FCMB is calculated as 9.21x.
PEG ratio against the expected Q2 earnings is 0.35, being less than 1 implies that FCMB is underpriced.
Q2 2022 earnings per share of N0.48 is projected for FCMB.
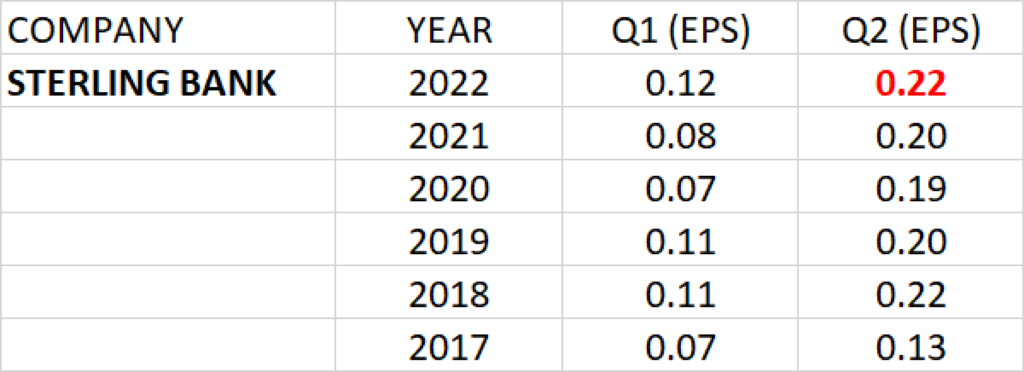
STERLING BANK
Q2 earnings per share of Sterling Bank over the last 5 years has geometric average growth rate of 11.37%.
At the current share price of N1.52 and Q2 2021 earnings per share of 20 kobo, P.E ratio of Sterling Bank is calculated as 7.60x.
PEG ratio against the expected Q2 earnings 0.67.
Q2 2022 earnings per share of 22 kobo is projected for Sterling Bank.
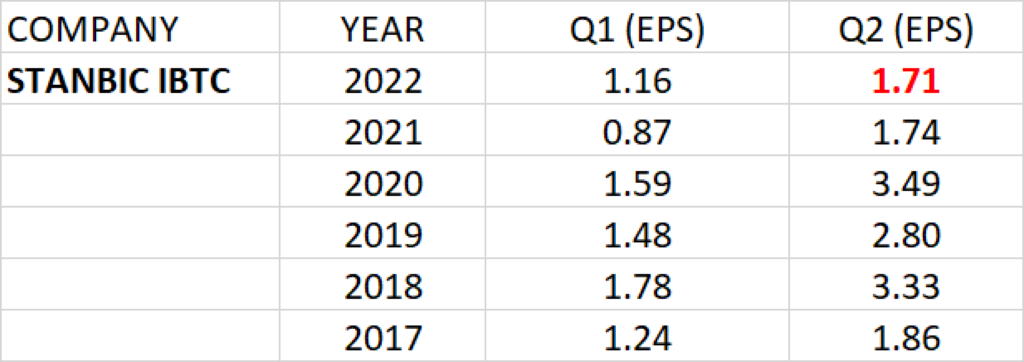
STANBIC IBTC
Q2 earnings per share of Stanbic IBTC over the last 5 years has a negative growth rate of -1.65%.
At the current share price of N34 and Q2 2021 earnings per share of N1.74, P.E ratio of Stanbic IBTC is calculated as 19.54x.
Q2 2022 earnings per share of N1.71 is projected for Stanbic IBTC.
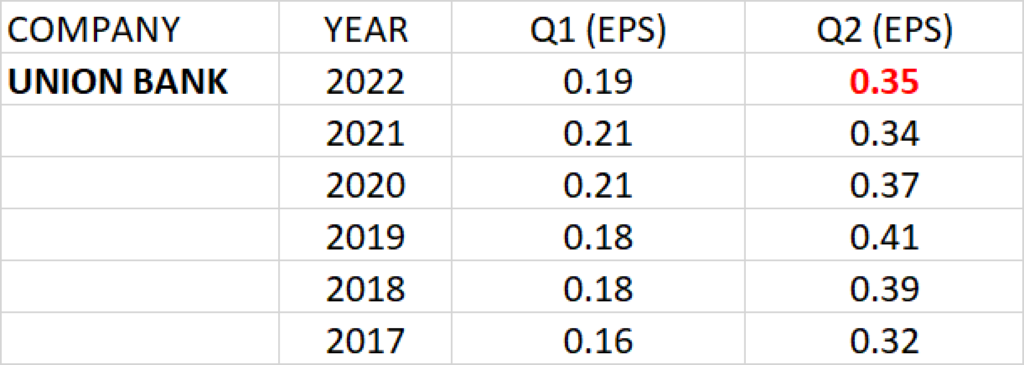
UNION BANK
Q2 earnings per share of Union Bank over the last 5 years has geometric average growth rate of 1.53%.
At the current share price of N6.5 and Q2 2021 earnings per share of N0.34, P.E ratio of Union Bank is calculated as 19.12x.
Q2 2022 earnings per share of N0.35 is projected for Union Bank.
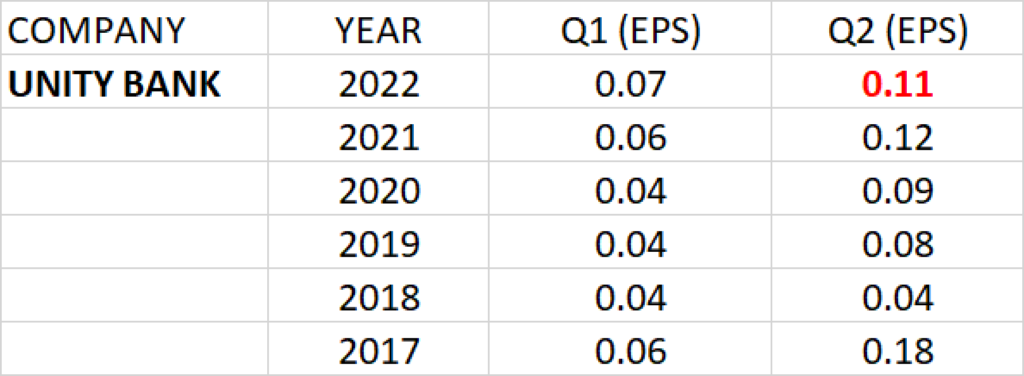
UNITY BANK
Q2 earnings per share of Unity Bank over the last 5 years has negative growth rate of -9.64%.
At the current share price of N0.47 and Q2 2021 earnings per share of N0.12, P.E ratio of Unity Bank is calculated as 3.9x.
Q2 2022 earnings per share of N0.11 is projected for Unity Bank.