Performance of quoted companies for Q3 results released so far is mixed and it is an indication that the future is bright. This year was really tough on businesses as Covid-19 pandemic brought compulsory lockdown. Not quite long after that, EndSARS protest also came with another brick wall on businesses. If companies could still release good results, despite obvious challenges, then we could say they have not done badly.
The Nigerian equity market achieved a significant feat on Friday, October 2nd, 2020 as it recovered from prolonged negative returns since the beginning of the year. This recovery can be attributed to the bullish run that started precisely from 18th of September 2020. Year to date, the market has returned 13.74%.
The second quarter of 2020 ended amidst partial lockdown of the economy caused by covid-19 pandemic. At the end of second quarter, the market returned -8.80%.
At the end of the third quarter, the market significantly improved, almost wiping off its losses to -0.04%. Entering into the fourth quarter of the year, precisely 2nd of October 2020, the market grew to 0.54% wiping off the negative returns since the beginning of the year. The market has not looked back after the recovery, rather it has been on the upward trend with 13.74% growth year to date.
We have seen a number of Q3 reports of quoted companies been released, most especially last week. Apart from Stanbic IBTC that released its result last week, the market is still waiting for the Q3 results of other banking stocks.
Q3 results of most banks should start hitting the market this new week. Looking at the trend with banking stocks, they have already shown growth from Q1 to Q2, so we should not expect anything worse in Q3 or anything less than what they achieved in Q2.
Our projections of Q3 earnings for banks is based on their PEG ratios. PEG ratio (price/earnings to growth ratio) is a valuation metric for determining the relative trade-off between the price of a stock, the earnings generated per share (EPS), and the company’s expected growth. In other words, it is not enough for anyone to invest on just the strength of a company’s previous or latest earnings but these in addition to the expected earnings.
ACCESS BANK
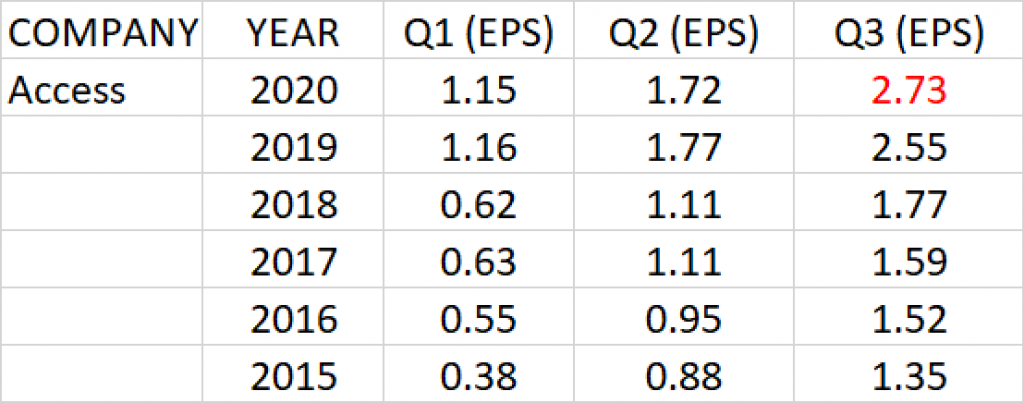
Earnings history of Access Bank Plc for Q1, Q2 and Q3 for the past 6 years show that the bank has been consistent in improving on its earnings per share year on year.
Consistent growth is observed in the bank’s results within a financial year, Q1, Q2 and Q3. In other words, there was not a lower performance in a current quarter than the preceding quarter within a financial year.
Q3 earnings per share (EPS) of the bank over the last 5 years has a geometric average growth rate of 17.20%.
Relative to the share price of N7.7 and Q3’19 earnings per share of N2.55, P.E ratio is estimated at 3.10x.
PEG ratio against the expected Q3 earnings is 0.18 and it implies that the share price of Access Bank at current price is underpriced.
Earnings per share of N2.73 is projected for Access Bank Plc in Q3’20.
ZENITH BANK
Zenith Bank has performed over the years with consistent growth in turnover, profit after tax and earnings per share especially with good dividend pay-out record. The Bank has been consistent with both interim and final dividend.
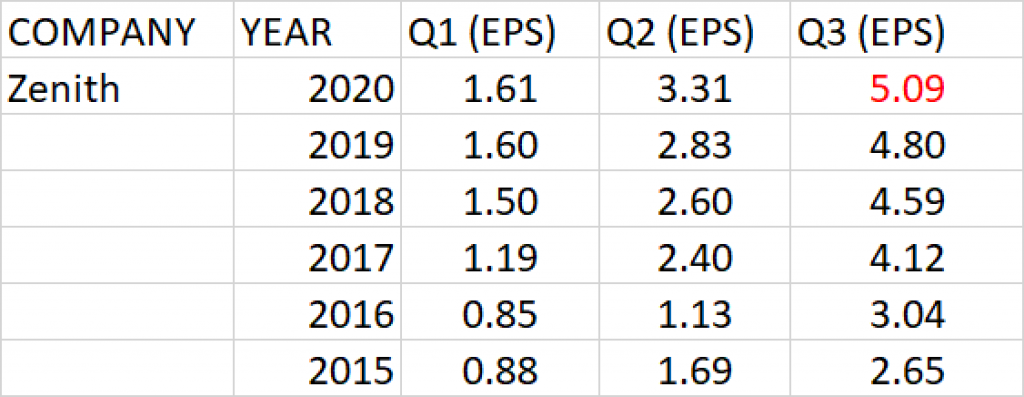
Earnings history of Zenith Bank for Q1, Q2 and Q3 in the past 6 years show that the bank has been consistent in improving on its earnings per share year on year.
Consistent growth is observed in the bank’s results within a financial year, Q1 to Q3. In other words, there was not a lower performance in a current quarter than the preceding quarter within a financial year.
Q3 earnings per share (EPS) of the bank over the last 5 years has a geometric growth rate of 16.05%.
Relative to the current share price of N22.1 and Q3’19 earnings per share of N4.80, P.E ratio is evaluated as 4.60x.
PEG ratio against the expected Q3 earnings is 0.29, which makes the share price of Zenith Bank underpriced at current price.
Q3 earnings per share of about N5.09 is projected for Zenith Bank in 2020.
GUARANTY TRUST BANK
Guaranty Trust bank in the last five years has shown consistent growth in Q3 profit after tax and earnings per share. The bank has been consistent with dividend payout of both interim and final.
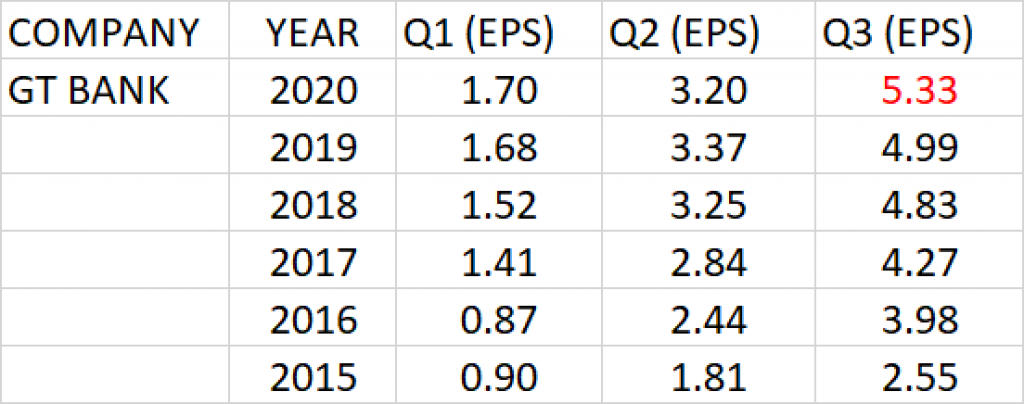
Except for Q2’20 where EPS dropped to N3.20, the earnings history of the Guaranty Trust Bank for Q1, Q2 and Q3 over the years show that the Guaranty Trust Bank has been consistent growing its earnings per share.
Q3 earnings per share (EPS) of the bank since 2015 has a geometric average growth rate of 18.26%.
Relative to the current share price of N32.50 and Q3’19 earnings per share of N4.99, P.E ratio of the bank is calculated as 6.51x.
PEG ratio against the expected Q3 earnings is 0.36, which makes the share price of Guaranty Trust Bank underpriced at current price.
Q3 earnings per share of N5.33 is projected for Guaranty Trust Bank.
FIRST BANK OF NIGERIA HOLDINGS (FBNH)
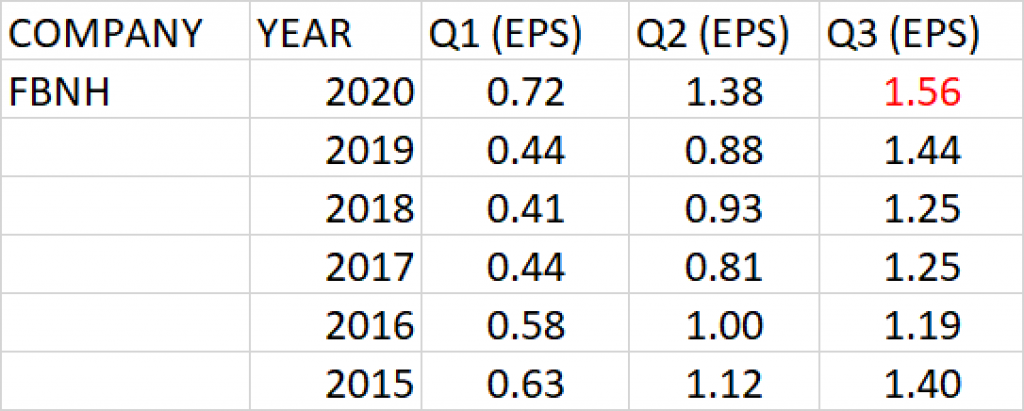
The share price of the big elephant has performed over the years and the stock is very resilient. There is hardly no portfolio that you don’t find First Bank, no matter how small the unit is. The effort the management of the bank have put into cleaning their book of non-performing loan is very credible.
Q2’20 earnings of FBNH grew by 56.82% to N1.38 from N0.88.
Consistent growth is observed in the bank’s results within a financial year, Q1 to Q3. In other words, there was not a lower performance in a current quarter than the preceding quarter within a financial year.
Q3 earnings per share (EPS) of the bank over the last 5 years has a geometric average growth rate of 0.76%.
Relative to the current share price of N6.5 and Q3’19 earnings per share of N1.44, P.E ratio of the bank is calculated as 4.51x.
EPS of N1.56 is projected for FBNH in Q3’20 financials.
UNITED BANK FOR AFRICA
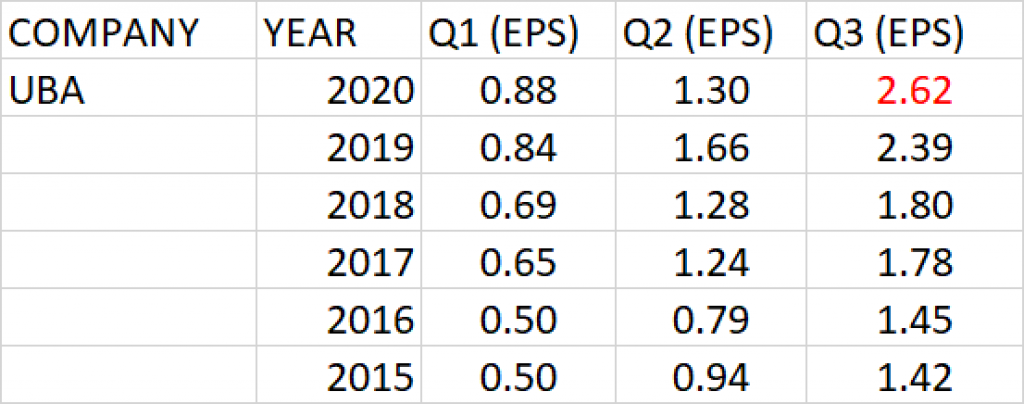
Despite the drop in Q2’20 Earnings per share of UBA, the bank was still able to pay 17 kobo interim dividend to its shareholders.
Consistent growth is observed in the bank’s results within a financial year, Q1 to Q3.
Q3 earnings per share (EPS) of the bank over the last 5 years has a geometric average growth rate of 13.87%.
Relative to the current share price of N7.7 and Q3’19 earnings per share of N2.39, P.E ratio of UBA is evaluated as 3.23x.
PEG ratio against the expected Q3 earnings is 0.23, which makes the share price of UBA underpriced at current price.
Q3 earnings per share of N2.62 is projected for UBA.
ECOBANK
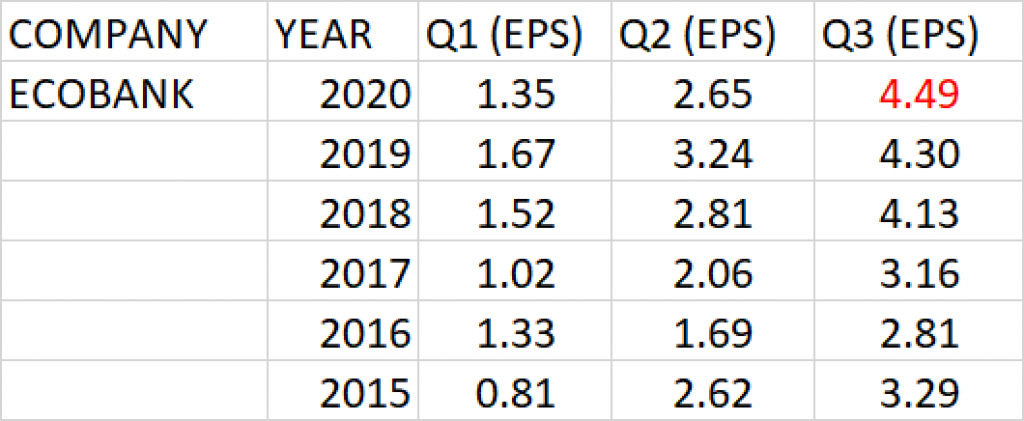
Q3 earnings per share (EPS) of the Ecobank Nigeria since 2015 has a geometric average growth rate of 6.88%.
Relative to the current share price of N5.65 and Q3’19 earnings per share of N4.30, P.E ratio of Ecobank is calculated as 1.32x.
PEG ratio against the expected Q3 earnings is 0.19, which makes the share price of Ecobank underpriced at current price of N5.65.
Q3 earnings per share of N4.49 is projected for Ecobank.
WEMA BANK
An in-depth study of the Wema Bank’s operation in the last ten years revealed that much has been done in rebranding, repositioning and refocusing even in the face of challenging economy and unstable policies that saw the bank at a time opting for a regional license before a subsequent upgrade.
The strength of the bank remains its foundation, visible repositioning in the previous years and the seamless succession.
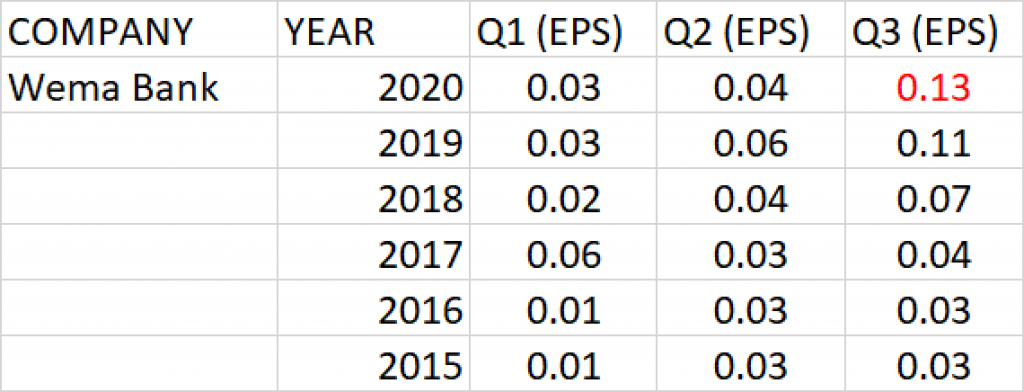
The Bank’s Q2 earnings per share dropped to 4 kobo from 6 kobo which can be attributed to the impact of COVID-19 pandemic.
Relative to the current share price of N0.64 and Q3’19 earnings per share of N0.11, P.E ratio of the bank is calculated as 5.82x.
Q2 earnings per share of 13 kobo is projected for Wema Bank.
FCMB
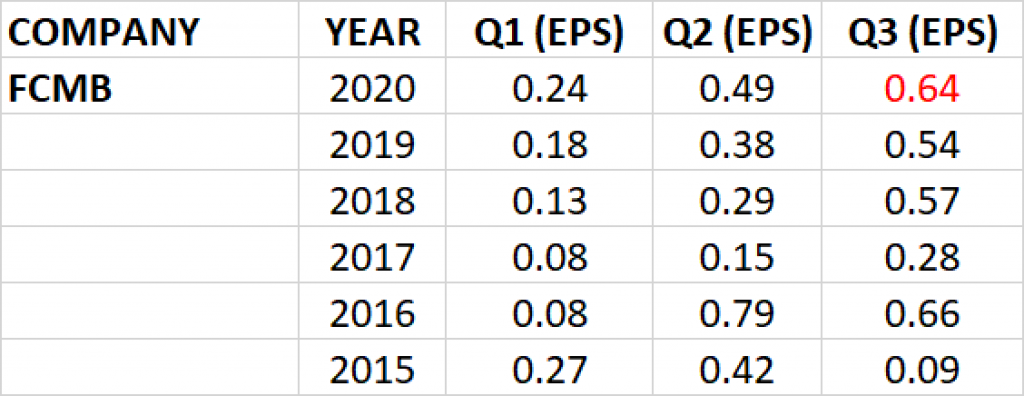
Earning history of First City Monument Bank shows growth in the Banks Q1, Q2 and Q3 EPS since 2015.
Q3 earnings per share (EPS) of the bank over the last 5 years has a geometric average growth rate of 55.08%.
Relative to the current share price of N3.13 and Q3’19 earnings per share of N0.54, P.E ratio of the FCMB is calculated as 5.74x.
PEG ratio against the expected Q3 earnings is 0.10, which suggests that the current price could be considered cheap.
Q3 earnings per share of N0.64 is projected for FCMB.
STERLING BANK
Sterling Bank evolved from a merger of 4 other banks – Indo-Nigeria Merchant Bank, Magnum Trust Bank, NBM Bank and Trust Bank of Africa – as part of the 2006 consolidation of the Nigerian banking industry. Under the new leadership of Abubakar Suleiman, the One Customer Bank has been up on its game to give value its investors and stakeholders.
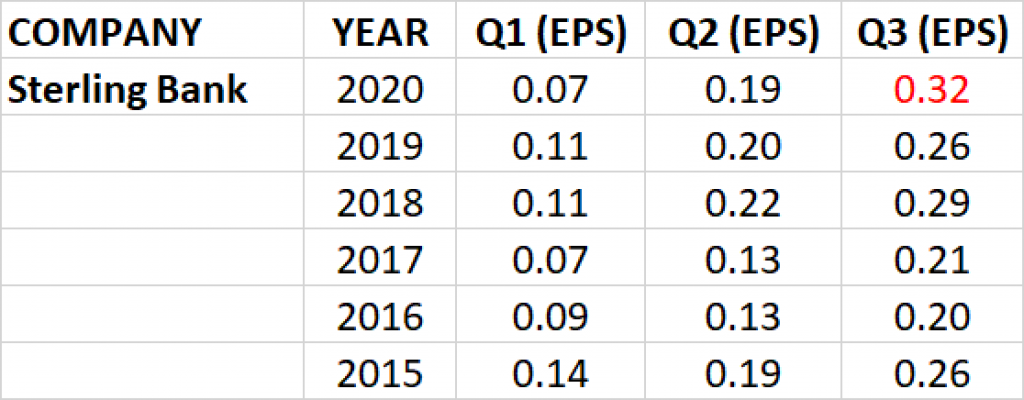
Growth has not been that consistent for Q3 earnings of Sterling Bank in the last 5 years. In actual fact, the geometric average growth rate in 5 years is 0.1%.
Relative to the current share price of N1.77 and Q3’19 earnings per share of N0.26, P.E ratio of the Bank is calculated as 6.72x.
PEG ratio of the bank is quite high and it implies that the current price of the stock is overpriced.
Q3 earnings per share of N0.32 is projected for Sterling Bank.
UNION BANK PLC:
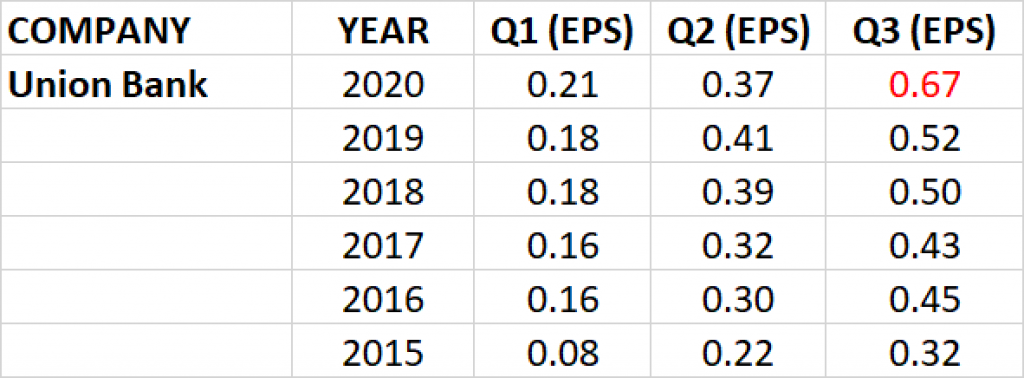
Q3 earnings per share (EPS) of the Union Bank since 2015 has a geometric average growth rate of 12.94%.
Relative to the current share price of N5.6 and Q3’19 earnings per share of N0.52, P.E ratio of the bank is calculated as 10.73x.
Q3 earnings per share of N0.67 is projected for Union Bank.
