Originally developed by Mario Farina, in his 1969 Book, A Beginner’s Guide To Successful Investing In The Stock Market and later made popular by Peter Lynch in his 1989 book One Up on Wall Street, Wikipedia defines the PEG ratio- price/earnings to growth ratio as a valuation metric for determining the relative trade-off between the price of a stock, the earnings generated per share (EPS), and the company’s expected growth. In other words, it is not enough for anyone to invest on just the strength of a company’s previous or latest earnings but these in addition to the expected earnings.
Basic truth about investment is that it is always done against an expectation. Technically, all investments being undertaken today are expected to grow in the future, the future could be a couple of months or years. Of importance therefore, should be not just past growth rates but also future possibilities. Analysis of previous years’ performance should only lead to projections and forecast of earnings to be released.
Common practise among investors is to gauge released company earnings against the immediate past. In as much as that might not be an error in itself, the most appropriate should be gauging released earnings with projections and forecasts that had been made before the earnings are released. Consequent actions on purchase, sales or hold should be hinged on this. Stock of a good company is that where released earnings are superior, not to past reports but forecasts made before the release of the reports. In the same vein, stock of a bad company is where released earnings are inferior, not to previous earnings released but to forecasts made. This thus suggests that after the release of a report, what investors should do is first gauge the report against the forecast and immediately go to work, forecasting the next reports.
Relating P/E Ratio, Wikipedia further states that the P/E ratio is higher for a company with a higher growth rate. Thus using just the P/E ratio would make high-growth companies appear overvalued relative to others. It is assumed that by dividing the P/E ratio by the earnings growth rate, the resulting ratio is better for comparing companies with different growth rates. The import of this is that P/E Ratio is somewhat limited because it considers principally, current or past performances but when this is appraised against an expectation, P/E Ratio becomes far more meaningful in its use.
The PEG ratio is therefore considered to be a convenient approximation. In a nutshell, the P/E ratio of any company that’s fairly priced will equal its growth rate, that is, a fairly valued company will have its PEG equal to 1. If PEG is lower than 1, it will suggests that the stock price of the company is lower than expected value.
Q3 PEG RATIOS OF NIGERIA’S TIER-2 BANKS:
Generally, Q3 earnings of financial institutions are not expected to show significant growth across board. In the last quarter, in the face of a struggling economy with slowing growth rates and diminish purchasing power of the populace, sources of income to the bank had dwindled significantly.
TRUTH ABOUT TIER-2 BANKS:
Of course they operate in different capacities which hinged on the strength and integrity of ownership, recent withdrawal of a tier-2 bank license and the subsequent loss of investment is an eye opener. Investing in tier-2 banks carries substantial risks but prices are low enough such that a near accurate projections and strategic entry could be very profitable.
It is noteworthy for investors that though a number of tier-2 banks are very liquid, they are never a part of major picks or considerations for foreign investors as well as frontline local institutional investors which include pension funds administrators. Activities are therefore determined by strength of retail investors and share ownership structure.
FCMB HOLDING PLC:
Though a holding company, its bank component is major.
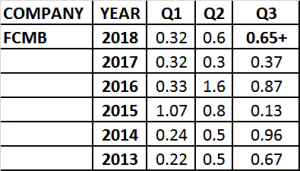
Going by FCMBH’s 57 kobo 2018 Q2 EPS, current PER is 2.9. By any standard, it could be said that current price of N1.64 looks cheap but what do previous earnings say about the institution?
The organisation’s earnings do not seem to follow any pattern. In other words, the organisation is not consistent in its earnings release. In the last five years for example, there was a scenario in 2015 where its Q1 EPS was N1.07, declined in Q2 to N0.84 and in Q3 to N0.13. 2016 Q2 was almost double its Q3 of same year. 2017 was similar as Q1 EPS was higher than Q2.
Investing in such an organisation without consistent growth pattern should require a measure of caution. Taking 2017 however as the base year, with the assumption that ‘all things will be equal’, seeing that Q2 EPS had been far better than Q3 since 2015 until 2017 when a seeming reversal is sighted, 2018 Q3 will go a long way in establishing or not, the trend showing relationship between its Q2 and Q3. The organisation has a record of one year up and another down in its Q3, but even at that, the odd still largely favours an up 2018 Q3 earnings more so as it is observed that FCMBH had always grown substantially its Q3 in a year after there was a decline in Q3 against Q2. Q3 of 2018 is expected to show a measure of growth above Q3 of 2017.
In view of the above, if the estimated Q3 EPS is achieved, PEG will be significantly low to suggest that current price could be considered cheap.
NNPC funds still remain with the bank component of the group. Repayment plans might depress earnings.
WEMA BANK PLC:
With seeming inbuilt survival abilities at inception by its founders, Wema could be best described as ‘cat with nine lives’
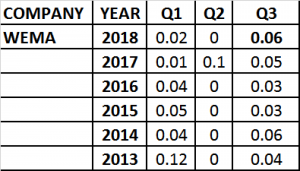
The bank’s has been most consistent in Q3 particularly since 2015 as it is observed that it has refused to fall below the previous in earnings till 2017 where there was a growth of about 7%. Relationship between Q1 and Q2 could also be established to be inching up in 2018 with a growth of about 100% in Q2 over Q1 level.
A cursory analysis of the bank’s operation in the last ten years revealed that much has been done in rebranding, repositioning and refocusing even in the face of challenging economy and unstable policies that saw the bank at a time opting for a regional license before a subsequent upgrade.
The strength of the bank remains its foundation, visible repositioning in the previous years and the seamless succession.
If an estimated 6kobo 2018 Q3 EPS is achieved, as low as the expected growth rate of about 6% may sound, it will still present the bank stock price of N0.66 as good enough for consideration.
The bank is looking to float bond for working capital.
Wema Bank is free of such encumbrances as are common with a number of Nigeria’s tier-2 banks, NNPC funds.
FIDELITY BANK PLC:
Up until Q3 2013, Reginald Ihejiahi was the Managing Director of Fidelity Bank Plc. He didn’t do badly. Nnamdi Okonkwo’s abilities began to reflect in the bank’s operation in Q1 of 2014 because a portion of Q4 performances of 2013 were efforts of the previous administration of the bank. Seeing that Q1 and Q2 of 2014 were lower than 2013 performances with Q3 also growing marginally, Okonkwo could be said to have started low in Fidelity. His efforts yielded minimal growth in 2015 while the bank, in 2016 was under the burden of having to return all or a portion of unremitted NNPC funds in its kitty. Consequently, Q1 to Q3 earnings of the year were lower than the records of 2015. Consistency however returned in 2017 upon which 2018’s Q1 and Q2 seem to have acquired a measure of strength.
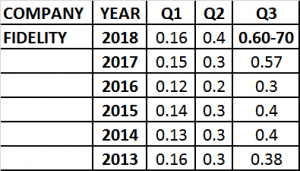
Consistent growth is observed in the bank’s results within a financial year, Q1 to Q3. In other words, there was not a lower performance in a current quarter than the preceding quarter within a financial year.
- Q1 to Q2 had growth by average 100% annually.
- Q2 to Q3 had growth at an average 45% annually
- Relationship between its Q1 and Q3 is about 180% growth
- 2018 Q3 is expected conservatively, to be in region of 60. This could stretch to N0.70
- If this is achieved, Forward 2018 Q3 PER is expected to be 3.13
- PEG RATIO against the expected Q3 earnings is 0.6 which makes the stock price of Fidelity at current price cheap and good enough for a medium term hold.
- If Fidelity does above 60 kobo to about 70 kobo in its Q3 earnings, which is possible, the stock’s current price remains super-cheap.
STERLING BANK PLC:
Sterling Bank Plc was one of the banks named to be in custody of NNPC’s unremitted funds to the tune of $269m.
Significantly, earnings released by the bank since 2013 had shown varied degrees of decline though it has shown consistent growth in QoQ performances since 2014.
Seeing that the bank’s current MD/CEO, Abubakar Suleiman resumed in January 2018, though this might still require another cycle of one year or more to affirm, it seems very much that the bank, under the leadership of Abubakar, who was until his appointment as the CEO, the bank’s Executive Director of Finance seems to have found a profit growing tactic.
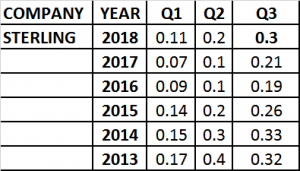
- Mere observation of the bank’s earnings revealed significant decline in YoY performances in all the three quarters under review between 2013 and 2017.
- Between 2017 and 2018 however, for the Q1, there was a growth of 57% and on its Q2, there was a growth of 69%.
- Customarily, relationship between the bank’s Q1 and Q2 seems being maintained at average 80% while Q2 to Q3 relationship had been about 40% since 2014.
- Notably, the bank as at 2018 Q2 had done more than it did in Q3 of 2017. Significant growth is therefore being expected in 2018 Q3 against its performance in 2017. The Q3 for 2018 is expected to be at least 30.
- At current price of N1.51, the earnings possibility is good enough.
- If the N0.30 is achieved, its PEG RATIO against the 2018 Q3 earnings is 11. This would imply that the stock is grossly under priced.
UNION BANK PLC:
Since UBN was taken over by the Central Bank of Nigeria, sold and managed briefly by Mrs Funke Osibodu before handing over to the incumbent, Emeka Emuwa in 2012, it has not been that well with this one of the oldest financial institutions in Nigeria. While stories and allegations of assets stripping keep going around about the bank, newer generations institutions left Union Bank behind to such an extent that even a rebranding had failed to yield meaningful results, at least as far as figures can show.
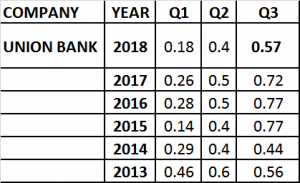
- Union Bank Plc’s earnings were down YoY in the period between 2013 and 2015.
- Improvement was noticed in 2016 in the three quarters under review but was truncated in just the following year, 2016. This subsists till Q1 and Q2 of 2018.
- Aside 2013, QoQ performances showed a measure of growth.
- Q1 2018 declined by 30% from 2017 while its 2018 Q2 declined by 29.6%.
- Past relationship particularly since 2014 between the bank’s Q2 and Q3 had been at an average 50% with the least being 18% in 2014 and highest being 102% in 2015.
- At a current price of N4.95 PER might still not look bad for the stock with its lower 2018 Q3 earnings but PEG Ratio will not be in favour of the bank so long as earning is showing possibilities of decline. At that, further price decline should not be strange except if a miracle had happened to the bank’s earnings between Q2 and Q3.